
Core Web Vitals Explained for Owners Who Don't Code
If you've spent ten minutes Googling why your site might be slow, you've hit three letter combinations that read like ham-radio call signs. LCP. INP. CLS. The articles explaining them are written by developers for developers, which is a problem when the person trying to learn is the operator who paid for the site. This is the resource I wish someone had handed me when I started rebuilding my own TruLight site.
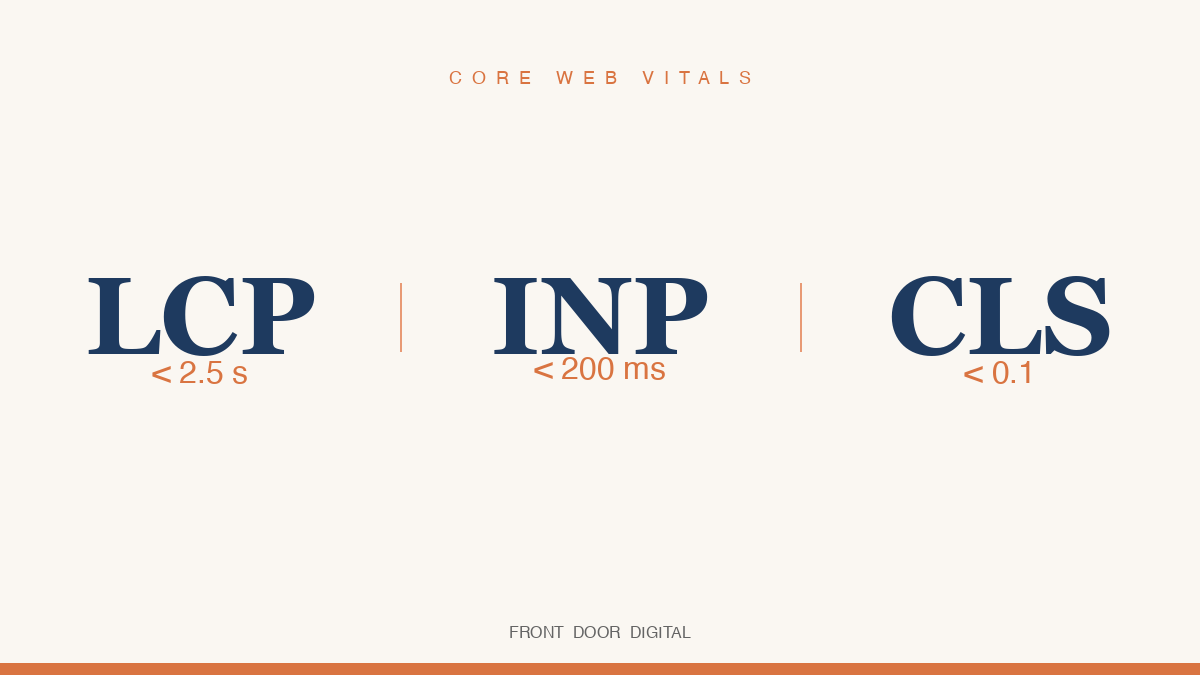
Core Web Vitals are the three numbers Google uses to grade how a real visitor experiences your page. Not how it looks in a screenshot. Not how it feels on your office Wi-Fi. How it behaves on a phone in someone's hand. They've been a confirmed Google ranking signal since June 2021, and according to Google's Search Central documentation, the current "good" thresholds are LCP under 2.5 seconds, INP under 200 milliseconds, and CLS under 0.1. If 75 percent of your real visitors hit those numbers or better, your page passes. The hard part isn't the numbers. It's knowing what each one is actually measuring and what it feels like to a customer when yours are bad.
What is LCP and why does Google care so much about it?
LCP stands for Largest Contentful Paint. In normal-person English: how long it takes for the biggest visible thing on your page (usually a hero photo or main headline) to finish loading. Google measures it from the moment the visitor asks for the page to the moment that biggest element is fully painted. Under 2.5 seconds is "good," 2.5 to 4 is "needs improvement," over 4 is "poor."
Google cares about LCP because it's the closest single metric to "how long until this site looks done." A visitor doesn't know about JavaScript bundles. They know whether they're staring at a blank screen or a finished page. According to the 2025 Web Almanac, only 62 percent of mobile pages hit a good LCP score, making it the hardest of the three to pass. For page-builder sites, the share that passes is much lower.
What causes a bad LCP
The usual suspects, in order of how often I see them in audits:
- Giant uncompressed hero images. A photographer hands the owner a 4000-pixel JPEG, the owner uploads it as-is, and now the visitor's phone is downloading an 8 MB image to display in a 1200-pixel slot. The browser scales it for display, not for download.
- Slow server response. The technical name is TTFB (Time To First Byte): how long the browser sits there after asking for the page before the first byte comes back. On shared hosting, TTFB alone can be over a second.
- Render-blocking JavaScript. Most page builders ship a runtime that has to download, parse, and run before any content paints. Until that's done, your hero photo isn't going anywhere.
- Lazy-loaded hero images. If the developer set the hero photo to "lazy load" (only fetch when the user scrolls toward it), the browser delays the very thing LCP is timing.
What a customer experiences when LCP is bad
They tap your Google listing and stare at a white screen with a spinner. Three seconds. Four. Five. Most people have left by now. The ones who stayed see a half-painted page with the headline up but the photo still loading. They've already decided you're sketchy and they're back on Google looking at your competitor.
What good looks like in the wild
On the TruLight SLC rebuild, our LCP went from 1,920 ms on the old Lovable.app build to 391 ms on the new Next.js build, a 4.9x improvement on a metric where the threshold for "good" is 2,500 ms. Full breakdown at our TruLight SLC case study. A modern statically rendered site on a CDN (Content Delivery Network, a global network of servers holding copies of your page near every region) routinely hits LCP under one second. By contrast, DebugBear's builder benchmarks put the average Squarespace site near 8.79 seconds LCP and Wix typically in the 3-to-5 second band.
What is INP, and what does a bad one feel like to a customer?
INP stands for Interaction to Next Paint. It measures how long the page takes to visibly respond when someone taps a button, opens a menu, or types in a field. Google's web.dev documentation defines a "good" INP as under 200 ms, "needs improvement" between 200 and 500 ms, and "poor" over 500 ms. This metric replaced FID (First Input Delay) as a Core Web Vital in March 2024, which means a lot of older articles online are still teaching the wrong thing.
The plain-English version: when the user does something on your page, how long until they see that the page heard them. If a customer taps your "Get a Quote" button and nothing happens for half a second, that's a bad INP. They tap again. The form fires twice. They tap a third time. Your page feels broken.
What causes a bad INP
INP is almost always a JavaScript problem. Specifically:
- The main thread is blocked. The browser has one thread for running JavaScript, the same thread it uses to respond to taps. When a tracking script or third-party widget is doing work, the page cannot respond to the user. The 2025 Web Almanac puts the median Total Blocking Time on mobile at 1,916 milliseconds, up 58 percent in a single year. Most of that is third-party JavaScript.
- Heavy event handlers. When the user taps something, the page runs whatever code is attached to that tap. If that code does a lot (re-renders half the page, fires off six analytics calls), the user waits.
- External scripts attaching listeners to everything. Some analytics scripts attach a listener to every interactive element on the page so they can log clicks. That work runs every time the user taps anywhere, slowing every interaction.
- Interactions during initial load. If the user taps something while the page is still loading scripts, that tap might not get processed for a second or more.
What a customer experiences when INP is bad
They tap a service link in your nav. Nothing. They tap again. The page jumps to the wrong place because the first two taps queued up. They open an FAQ accordion and there's a noticeable lag before it expands. They tap "Submit" on a contact form and don't know if it worked. Some tap three times and you get three identical lead submissions. The technical cause is invisible. The frustration is not. INP is the metric most directly tied to a site that "feels broken" even when it visually looks fine.
What good looks like in the wild
A clean Next.js site with minimal third-party scripts hits INP under 100 ms, well inside Google's "good" band. A typical Wix site loaded with a chat widget, review carousel, three tracking pixels, and a booking embed often lands between 300 and 600 ms. The fix on the page-builder side is removing widgets you weren't using anyway. The fix on the platform side is removing the platform.
What is CLS, and how do I know if my site has it?
CLS stands for Cumulative Layout Shift. It measures how much stuff jumps around on your page while it's loading. Google's "good" threshold is under 0.1 on a unitless scale where smaller is better. Between 0.1 and 0.25 is "needs improvement," over 0.25 is "poor."
The classic example, from Google's web.dev documentation: you tap a button on a slow-loading mobile page and an ad loads right above it, pushing the button down a quarter-inch as your thumb comes down. You tap the ad. You did not want to tap the ad. The worst examples can make a user accidentally confirm an order they meant to cancel.
What causes a bad CLS
Three patterns account for most layout shift on local sites:
- Images and videos without dimensions. When the HTML doesn't tell the browser how big an image will be, the browser leaves zero space for it. Then the image loads and shoves everything below it down. Every img tag should have width and height attributes set. Most site builders don't do this consistently.
- Web fonts that swap mid-render. The page renders with a fallback font like Arial. Then your custom font finishes downloading and the browser swaps it in. The new font is slightly different in size, so every line of text shifts by a few pixels. On a content-heavy page that can throw CLS over 0.4, four times the failing threshold.
- Ads, embeds, and chat widgets that load late. A chat widget pops in three seconds after the page paints, pushing the entire footer down. A review carousel inserts itself into the middle of the page after the visitor has started reading. Each is a separate layout shift that adds to your cumulative score.
What a customer experiences when CLS is bad
They start to read a paragraph and the text jumps. They reach for the "Call Now" button and the layout shoves it down right as their thumb gets there. They tap the wrong link. The page feels alive in the worst way: like it can't sit still long enough for a person to use it. Most owners never notice because they've already loaded the page on their laptop with everything cached. The first load on a customer's phone is the only load that counts.
What good looks like in the wild
A site built with proper image dimensions, a preloaded font, and no late-injecting widgets sits at CLS 0.00 to 0.05, well inside Google's "good" band. A Squarespace template with a hero slideshow, a font that swaps after load, and a chat widget that drops in after three seconds typically lands between 0.15 and 0.30.
Curious where your site actually sits on these three metrics?
Get a free Front Door Score. Real Lighthouse numbers, all three Core Web Vitals on mobile, no email required to start. Takes about 90 seconds. Run the score on yours.
How do I find my own Core Web Vitals scores?
The fastest way is Google's own free tool, PageSpeed Insights. Paste your home-page URL into the box, select Mobile (not Desktop, because mobile is what Google grades you on), and run it. The "Core Web Vitals Assessment" panel at the top tells you whether you passed and shows your real-world LCP, INP, and CLS pulled from the Chrome User Experience Report. If your site doesn't get enough traffic for that real-world data, the lab numbers below it are a reasonable proxy.
One thing to watch out for: PageSpeed shows a Performance Score (the big colored number) alongside the Core Web Vitals. They are not the same thing. The Performance Score is a synthetic blend that includes things Google does not actually rank you on. A site can have a Performance Score of 65 and pass all three Core Web Vitals. A site can have a Performance Score of 90 and fail INP. Always read the Core Web Vitals Assessment panel first and treat the Performance Score as secondary. For a fuller walkthrough, see how to test your own website speed.
Why this matters more than your design refresh
Most local-business owners think about their site in terms of how it looks. The colors, the photos, the headline. That matters, but it's downstream of the technical layer. A beautiful site that fails Core Web Vitals gets outranked by an ugly site that passes them, and the customer who lands on the beautiful-but-slow site leaves before they see the design.
This is why most local-business sites are slower than they should be. The platform makes the design easy and the speed impossible. The fix is not a design problem, it's a stack problem. Move the same content onto a statically rendered framework like Next.js on Vercel's edge, and your Core Web Vitals stop being a leak in the funnel. They become the reason you outrank the guy down the street.
Frequently asked questions
What replaced FID, and why?
INP (Interaction to Next Paint) replaced FID (First Input Delay) as a Core Web Vital in March 2024. FID only measured delay on the first interaction. INP measures every interaction throughout the visit, then reports the worst one. It's a much more honest number. If you read an article about Core Web Vitals written before 2024, double-check that it covers INP and not FID.
Are Core Web Vitals more important than content?
No. Content quality is the primary ranking factor and Core Web Vitals are a tiebreaker. The catch for local-business owners is that in a category like "plumber Salt Lake City" or "roofer Austin," competitors usually have similar content, reviews, and service areas. The tiebreaker becomes the technical layer, and that's where most local sites are bleeding rank without anyone telling them.
How often does Google measure my Core Web Vitals?
Continuously, through anonymous data from real Chrome users. The data is aggregated over a 28-day rolling window, so a fix you ship today won't show up in Search Console for about a month. Lab tools like PageSpeed Insights show new numbers immediately, useful for verifying a change before the field-data refresh.
If I pass all three, am I done with site speed?
You're done with the part Google ranks you on. You're not done with the part your customer notices. A site that passes at the 75th percentile can still feel sluggish to users on slower phones. The goal on every Front Door Digital rebuild is sub-second LCP and sub-100 ms INP, roughly twice as fast as Google's "good" thresholds.
If you've made it this far, run PageSpeed on your home page before you close this tab. Mobile, not desktop. Read the Core Web Vitals panel first. If you're failing one or more, you know what that means now and what's causing it. The next question is whether your platform can be coaxed into passing or whether the honest answer is to rebuild on a stack that wasn't designed to fail this test.
Want to know how your site stacks up?
Get a free, no-pitch score on speed, SEO, and AI search. Takes about 90 seconds.